April has been marked by accelerating bulls. The mood on digital currencies market is positive despite the moderate correction at the end of the month. Its impact was much stronger in the case of altcoins – Bitcoin stayed above $5200. What will be the next move of the cryptocurrency market and which coins were the biggest gainers? Let’s see – we are presenting Cryptocurrency Ranking April 2019.
In the February edition of Bithub’s Cryptocurrency Ranking we used for the first time a new method of selecting 30 coins. It is based on 30-day volume. Our new method allows us to examine the most „popular” projects in each month, which cannot be determined by looking at their marketcaps. What is more, the Ranking’s structure will not be pernament – it will gain the possibility of including different coins every month. For this purpose we use data from coinmarketcap. As every month, we present ROI of 30 digital curriencies exluding stablecoins.
Cryptocurrency Ranking April 2019
List of 30 cryptocurrencies with highest volume in February and their marketcap
At the beginnig of the month, Bitcoin’s price was above 4100$, but on the 2nd of April it surged to 4800$. Then, it rose steadily during next few days. From the 6th of April it oscillated between 5000$ – 5300$. After that, on the 22nd of April, price went up by about $300 and tested the resistance at 5600$. It did not make it and rapidly fell to 5200$. At this level we closed the month.
Total Market Capitalization
Total market capitalization reflects BTC’s trend. When Bitcoin is doing well, other digital curriencies benefit from that. Their gains are often two or three times higher than Bitcoin’s.
Total Market Capitalization (exluding Bitcoin)
Bitcoin’ Market Dominance
Percentage of Bitcoin’s total market capitalization (dominance) significantly increased in April – from 50,12% to 54,20%.
Bitcoin’s Volatility (30-Day)
Standard deviation of daily returns (Bitcoin’s Volatility) increased nearly by three times from 1,33% to nearly 4%.
Bitcoin’s Transaction Volume
At the beginning of the month, Bitcoin’s transaction volume fell from 4,5B to around 1B. Then it oscillated between 1,5B and 6B. On the 25th of April it reached the highest value (around 8B) and closed the month at around 3B.
Bitcoin’s Confirmed Transactions Per Day
Until 23rd of April, the number of Bitcoin’s Confirmed Transactions Per Day oscillated between 310k and 400k, but the lowest values got lower and lower. Then it increased and reached around 360k at the end of the month.
Total Transactions Fees
Total transactions fees increased nearly two times during April.
Bitcoin’s Average Transaction Value
Bitcoin’s Average Transaction Value was in the strong upward trend during April. At the end of the month it reached 12k.
Google Scholar – number of articles related to cryptocurrencies
According to Google Scholar, 248 scientific papers related to Bitcoin were published in April – it is exactly 4 times less than in March. Phrase „Litecoin” can be found in 13 articles (11 times less than in March), „Ethereum” – in 76 articles (nearly 8 times less than in last month), „Bitcoin Cash” – only in one article.
Google Trends – crypto phrases
Bitcoin
Number of „Bitcoin” phrase searches surged at the beginning of April – it was because of rapid increase of its price. Then, the general interest fell and stayed around 50 points. As far as geography factors are concerned, „Bitcoin” phrase was the most popular in Nigeria for the third time in a row. The next positions were respectively occupied by China, Saint Helena Island, RPA and Ghana. We can see that the first five is the same as in March and February.
Cryptocurrency
General interest in „cryptocurrency” phrase was similiar to „Bitcoin” phrase. At the beginning of the month it rose together with the BTC’s price. Then, it fell to 50 points level and oscillated around that value to the end of April. For the next time, „cryptocurrency” phrase was searched most often on Saint Helena Island and Slovenia took the second place, being only 5 points away from the first place. Third, fourth and fifth were Netherlands, Zambia and Uganda.
blockchain
This time „Blockchain” phrase was the most popular in Georgia, which overtook last month leader – China. On the third, fourth and fifth place we can see respectively Saint Helena Island, Ghana and South Korea.
Number of Bitcoin ATMs
There were 4705 Bitcoin ATM’s all over the world at the end of April. It is 318 more than at the end of March. Bitcoin ATM industry is thriving because of rising popularity in South America, especially in Venezuela and Columbia. Citizens of countries that are in bad economic shape (usually developing countries) are looking for alternatives to FIAT money and often decide to use cryptocurrencies. Bitcoin ATMs are the easiest way for many people to buy them. This results in increased adoption of Bitcoin and makes it closer to the wider public.
Comments
Daniel Draganov:
During the last month (April) Bitcoin was fluctuating mostly above the 5K level. This led to a lot of altcoin rallies, although there weren’t as significant pumps as those in March. In my opinion this means that there are no new fresh money in the crypto market. We even saw new ATL for some of the coins. 4.2K was very important resistance level, and it’s inevitably to expect it to be tested as a support. If BTC holds that level I can conclude that the whole crypto market has bottomed and we are currently in the accumulation phase of the new market cycle. It’s possible to see another leg up (max 6k), but the most adequate scenario is to expect some relief move to see a healthy retrace to the 4k level.
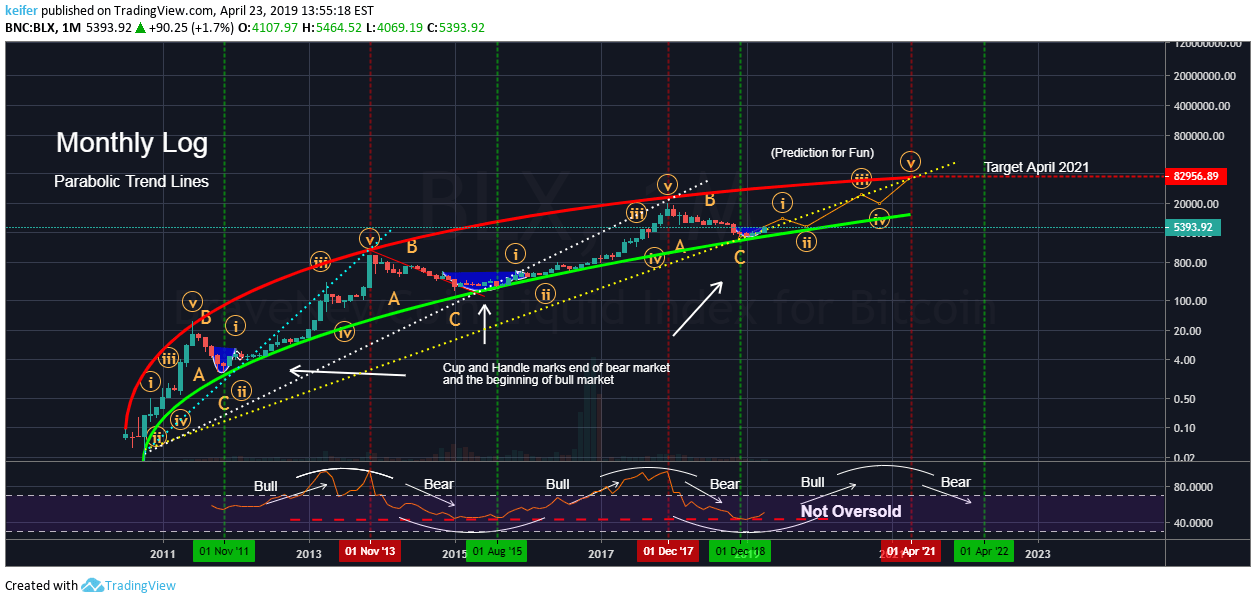
Keith Greenshields:
This chart I put together was originally for myself. I had recently discovered trendlines really don’t work so much compared to parabolic lines. Every trendline breaks in either direction regardless of a bull/bear market. Support and resistance never stays the same yet using parabolic lines seems to flow better when it comes to having a clue as to where BTCis going.
So just for fun I tried to come up with a prediction that flows along with the parabolic curve and here I present to you this idea. Take notice that the cup and handle (3) has been the signal that shows the end of the bear market and the beginnings of the bull market.
One last thing, take a look at the dotted lines that intersect the parabolic lines. Here I plotted 3 different colored trend lines and extended them from BTCslowest low, intersecting the lowest low of each of the bear markets and then extended them upwards throughout each bull market. To my surprise these lines predicted the top of the market and the beginnings of a bear market. I don’t know about you, but I find that fascinating.
Dziękujemy, że przeczytałeś/aś nasz artykuł do końca. Obserwuj nas w Wiadomościach Google i bądź na bieżąco!